
Considering that bond prices typically move in the opposite direction of rates:
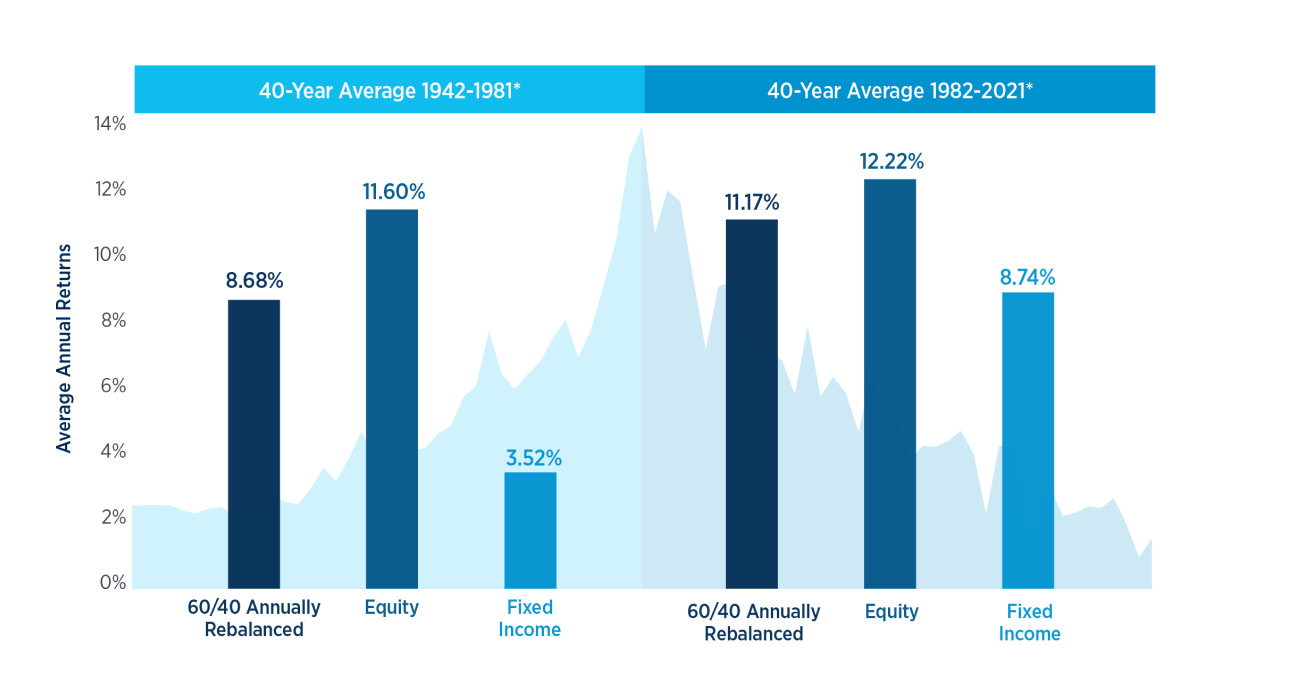
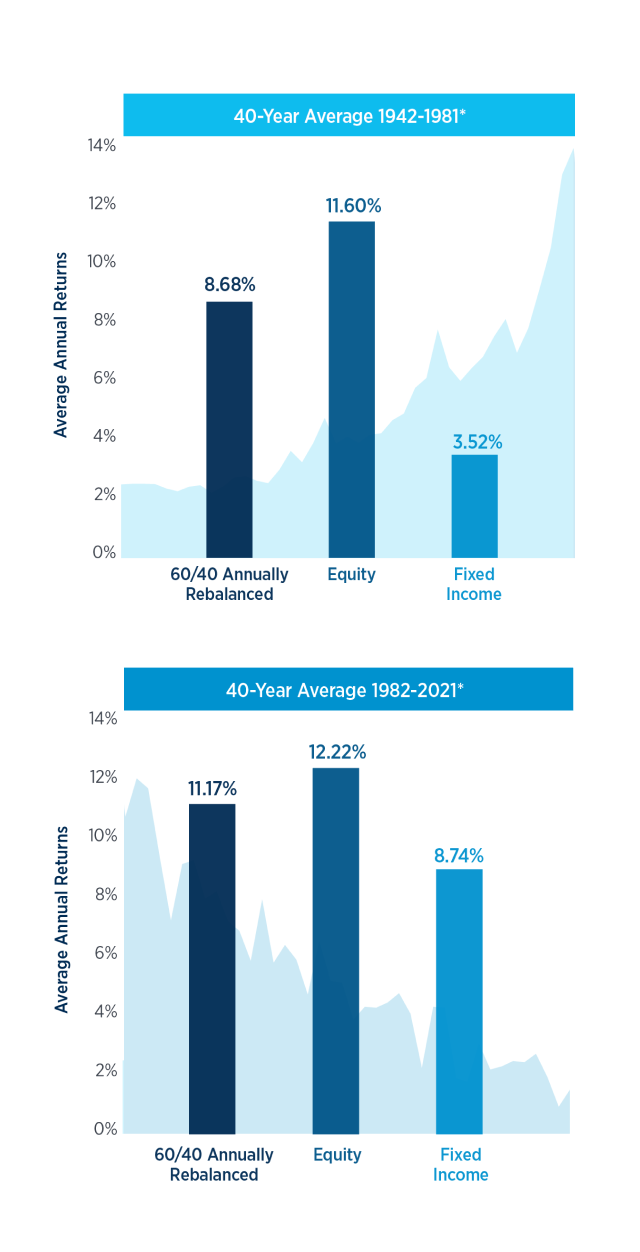
1. How would a portfolio allocated 60% in equity and 40% in fixed income have performed across each of these 40-year spans, assuming annual rebalancing to restore the 60% equity and 40% fixed income allocation?
2. How did the performance of the fixed income portion of a portfolio during these two periods affect the overall portfolio results?
For illustrative purposes only and does not reflect the performance of any Global Atlantic product nor any charges or expenses typically applicable when investing. Investors cannot invest directly in an index. Based on time periods 1/1/1942-12/31/1981 and 1/1/1982-12/31/2021. The hypothetical portfolio returns represent the compound annualized growth rate (CAGR) of 60% equity and 40% fixed income allocations, rebalanced annually. Equity is represented by the S&P 500 total return index. Fixed income is comprised of a blend of 40% US government bonds and 60% corporate bonds. See reverse for additional information.
* Past performance is no guarantee of future results. Does not reflect the performance of any Global Atlantic product or service.
The hypothetical 60/40 portfolio would have performed better during the 40-year period of falling rates, 1982-2021, 11.17% vs. 8.68% average annual returns.
As illustrated in the chart, equity performance was similar during both periods, while fixed income performance was much stronger during the period of falling rates, 8.74% vs. 3.52% average annual returns, allowing more money to remain allocated in equities during rebalancing.
Need help?
Find all the contact information to submit and service your business.